
Original research by Uprise Digital. Published 31 July 2026. Sample: 291 Australian service keywords tracked monthly from January 2018 to June 2026.
Every Australian service business owner has said some version of this: “the phone has gone quiet”. Usually it gets blamed on the website, the ad agency, or the economy.
We wanted to know what the search data actually says. So we pulled 101 months of Google search volume history for 291 service keywords across five industries and twelve Australian cities. That gave us a month-by-month picture of when Australians actually go looking for a tradie, a lawyer, a solar installer, a dentist or a property professional.
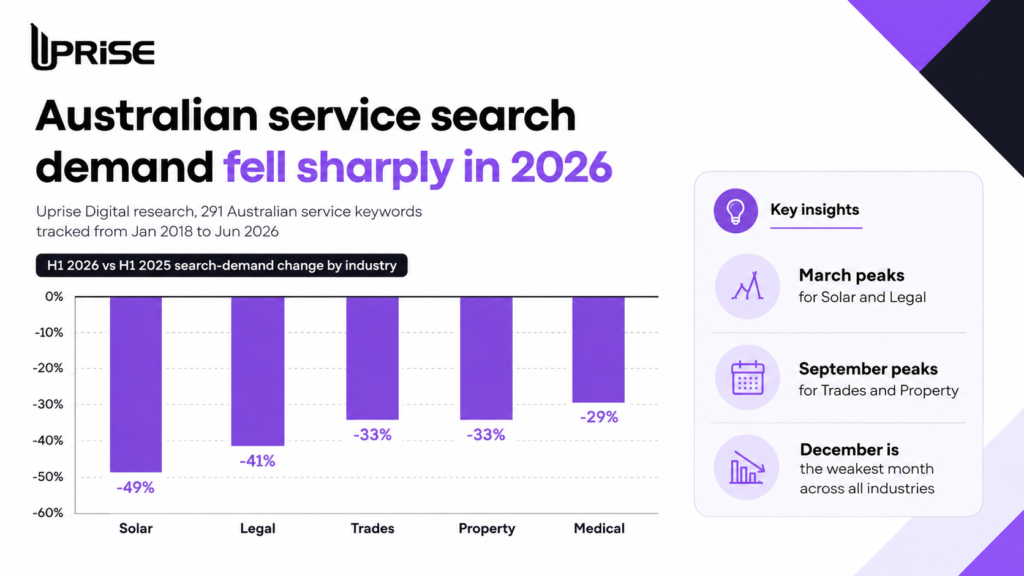
Two things came out of it. One is a stable seasonal calendar you can plan against. The other is a much bigger story: search demand for Australian services has fallen between 29% and 49% in the first half of 2026 compared with the first half of 2025.
Key findings
- Australian service search demand fell in every industry we measured in H1 2026. Solar fell 49%, legal 41%, trades 33%, property 33% and medical 29% against the same period in 2025.
- March is the biggest month of the year for solar and legal searches, running 20% and 19% above their yearly average.
- September is the biggest month for trades and property, at 19% and 12% above average.
- December is the worst month for every single industry we measured. Property drops to 74% of its yearly average, medical to 78%, trades and legal to 86%.
- The gap between the best and worst month is about 38% for solar and 46% for property. Businesses that spend the same amount every month are overspending in December and underspending in March.
- June is a weak month for legal (90% of average) and trades (94%), which matters because it sits right at the end of the Australian financial year.
- Medical is the most stable industry through the year, moving in a narrow band between 78% and 107% of its average.
Method
We built a list of 300 keywords by combining five industries (solar, legal, trades, medical, property), five common service searches in each, and twelve Australian cities: Sydney, Melbourne, Brisbane, Perth, Adelaide, the Gold Coast, Canberra, Newcastle, Hobart, Darwin, Geelong and Wollongong.
We pulled monthly Google search volume for each keyword from January 2018 to June 2026 using the DataForSEO API on 31 July 2026, set to location Australia and language English. Of the 300 keywords, 291 returned monthly history.
For the seasonal index we summed monthly search volume by industry across the four complete years from 2022 to 2025, then indexed each calendar month against that industry’s average month. An index of 100 means an average month. An index of 120 means that month runs 20% busier than normal.
We used 2022 to 2025 for the seasonal index deliberately. Earlier years are distorted by the pandemic, and 2026 is incomplete. For the year-on-year comparison we compared January to June 2026 against January to June 2025.
The Australian service demand calendar
This is the part you can plan against. It shows how busy each month is compared with a normal month in that industry.
| Month | Solar | Legal | Trades | Medical | Property |
|---|---|---|---|---|---|
| January | 103 | 101 | 97 | 107 | 107 |
| February | 107 | 107 | 95 | 97 | 106 |
| March | 120 | 119 | 100 | 103 | 107 |
| April | 105 | 107 | 97 | 99 | 103 |
| May | 100 | 105 | 107 | 103 | 109 |
| June | 97 | 90 | 94 | 99 | 95 |
| July | 97 | 96 | 97 | 106 | 99 |
| August | 89 | 94 | 105 | 104 | 98 |
| September | 111 | 107 | 119 | 101 | 112 |
| October | 95 | 95 | 109 | 104 | 101 |
| November | 92 | 93 | 94 | 99 | 89 |
| December | 82 | 86 | 86 | 78 | 74 |
What the calendar tells you
Solar and legal peak in March. Both run about 20% above their average month. For solar this lines up with the end of summer, when people have just lived through their highest quarterly power bill. For legal it lines up with the return to normal life after the January holidays, when people finally act on problems they sat on over summer.
Trades and property peak in September. Spring is when Australians fix the house and move house. Trades run 19% above average in September and stay high through October at 109.
December is bad for everyone. Property falls to 74, its worst month by a wide margin. Medical falls to 78. Nobody is booking a conveyancer or a chiropractor in the week before Christmas.
June is quietly weak. Legal drops to 90 and trades to 94. This is worth knowing because June is the end of the Australian financial year, and a lot of businesses assume it should be a strong month. In search terms it is not.
How to use this
The practical move is to stop spending the same amount every month. If you are a property business, a dollar spent in September reaches about 50% more searches than a dollar spent in December. If you are a solar installer, March is worth roughly 46% more than December.
The other move is to build content ahead of the peak, not during it. A page published in January has time to rank before the March solar peak. A page published in March has missed it.
The bigger story: demand fell hard in 2026
The seasonal pattern is stable. The overall level is not.
When we compared the first half of 2026 with the first half of 2025, every industry was down, and most were down a lot.
| Industry | Searches Jan-Jun 2025 | Searches Jan-Jun 2026 | Change |
|---|---|---|---|
| Solar | 273,700 | 139,970 | -49% |
| Legal | 480,240 | 285,000 | -41% |
| Trades | 683,670 | 461,200 | -33% |
| Property | 522,130 | 348,720 | -33% |
| Medical | 174,790 | 123,240 | -29% |
A drop of this size across five unrelated industries at the same time is not normal seasonality. Seasonality repeats. This does not appear in the 2022, 2023 or 2024 data.
What could explain it
We can measure the drop. We cannot prove the cause from this data alone. Here are the three explanations that fit, and what we think of each.
1. Searches are moving to AI assistants. When someone asks ChatGPT or Gemini to find them a good electrician in Brisbane, that search never reaches Google. This would reduce Google search volume without reducing actual demand for electricians. We think this is the largest single factor, and it is consistent with the drop being broad rather than industry-specific.
2. Google is changing how it reports search volume. Keyword Planner data has changed definition before. Some of this could be measurement rather than behaviour. We cannot rule it out.
3. Real economic softening. Australian households under cost-of-living pressure defer solar installs, elective medical work and moving house. This is real, but it does not explain why emergency plumbing searches fell too.
Our honest read is that most of this is behaviour change rather than demand disappearing. Australians still need plumbers. They are just asking a different machine.
Why this matters more than the percentage
If you run a service business and your Google traffic is down 30% while your competitors’ is too, your ranking has not got worse. The pool got smaller.
That changes what you should do about it. Fighting harder for the same Google rankings is fighting for a shrinking share. The businesses that will do well over the next two years are the ones that also show up when someone asks an AI assistant for a recommendation, which depends on being mentioned, reviewed and cited across the wider web rather than just ranking on one results page.
It also changes how you read your own reports. A 30% traffic drop in 2026 might mean you did nothing wrong. Check your rankings and your conversion rate before you blame either.
Industry detail
Solar
The most seasonal and the most affected. March runs at 120 and August at 89. Demand fell 49% year on year, the steepest drop in the study. Solar has the added complication that rebate changes move demand around independently of the seasons.
Legal
Peaks in March at 119, bottoms in December at 86. The June dip to 90 is notable. Down 41% year on year, the second steepest fall.
Trades
The spring industry. September at 119 and October at 109 are the two best months. February is the weakest non-December month at 95. Down 33% year on year.
Medical
The flattest calendar in the study, moving between 78 and 107. Aside from the December collapse, medical demand barely moves. Down 29% year on year, the mildest fall.
Property
The widest swing of any industry, from 112 in September to 74 in December, a 46% gap between best and worst. Down 33% year on year.
Turning the calendar into a budget
Most Australian service businesses split their marketing budget evenly across twelve months. The data says that is the wrong shape.
Here is a simple way to use the index. Take your annual budget, divide it by twelve to get an average month, then multiply each month by that month’s index divided by 100.
For a solar installer with a $60,000 annual budget, an average month is $5,000. March has an index of 120, so March gets $6,000. December has an index of 82, so December gets $4,100. Over the year you spend the same money, but it lands where the customers are.
| Industry | Months to spend heavily | Months to pull back | Best to worst gap |
|---|---|---|---|
| Solar | March, September, February | December, August | 38% |
| Legal | March, February, April, September | December, June | 33% |
| Trades | September, October, May | December, June | 33% |
| Medical | January, July, August | December | 29% |
| Property | September, May, January | December, November | 46% |
Two warnings on this.
First, the calendar tells you when people search, not when they buy. Legal enquiries in March may take three months to become paying matters. If your sales cycle is long, shift your spending earlier than the index suggests.
Second, content and ads work on different clocks. Paid ads can follow the index month by month because they turn on and off instantly. Content and SEO cannot. A page needs roughly three to six months to rank, so a solar page aimed at the March peak should be published in October or November, not February.
The businesses that get this right treat the quiet months as build time. December is the worst month to spend on ads in every industry we measured. It is a good month to write the pages that will earn traffic in March.
Limitations
- Search volume figures come from Google’s own reporting through the DataForSEO API. They are rounded and estimated, not exact counts.
- We sampled five services per industry across twelve cities. A different keyword set would shift the numbers.
- Nine of the 300 keywords returned no history and are excluded.
- The year-on-year drop is a measurement. The explanations we offer for it are informed opinion, not something this dataset proves.
- The medical series shows a structural break in late 2023 where volumes step down sharply. This may be a change in Google’s reporting rather than real behaviour, so treat long-run medical comparisons with care. The 2025 to 2026 comparison sits entirely after that break.
- City-level and national demand can differ. These are national totals across twelve cities.
Frequently asked questions
What is the busiest month for tradies in Australia?
September. Across 2022 to 2025, trades searches in September ran 19% above the average month. October is the second busiest at 9% above average.
When do Australians search for solar the most?
March, at 20% above the average month. September is second at 11% above. The quietest month is December at 18% below average.
What is the worst month for Australian service businesses?
December, in every industry we measured. Property searches fall 26% below average, medical 22%, trades and legal 14%, and solar 18%.
Why has my Google traffic dropped in 2026?
Possibly nothing you did. Across five Australian service industries, Google search volume in the first half of 2026 was 29% to 49% lower than the same period in 2025. If your rankings held steady and your traffic fell by roughly that much, you are seeing a smaller market rather than worse performance.
Is search demand in Australia really falling, or are people just using AI?
Both readings fit the data and we cannot separate them with this dataset. Our view is that most of the drop is people asking AI assistants instead of Google, because the fall is broad across unrelated industries and includes urgent services like emergency plumbing where real demand does not simply vanish.
When should I increase my marketing budget in Australia?
Spend ahead of your industry’s peak. For solar and legal that means building in January and February for a March peak. For trades and property it means building in July and August for a September peak. Cut back in December, when every industry we measured hits its lowest point of the year.
How to cite this study
You are welcome to use these figures in your own articles, reports and presentations. Please link back to this page so readers can check the method.
Suggested citation: Uprise Digital (2026). The Australian Service Demand Calendar: 101 months of search data across 5 industries and 12 cities. Published 31 July 2026.
Journalists and researchers who want the month-by-month dataset can contact us and we will send it through.